Tag Archives: el niño

August El Niño Updates

The big news out of the El Niño update for August is that the odds of a fall or winter event has dropped to 65% (from 80%). Australia’s Bureau of Meteorology even lowered their prediction to 50%. Several headlines I saw seemed to focus on that numerical change. Yes, 65% is indeed lower than 80%, but the odds still are pointing to a coming El Niño event. Plus, the odds remain about double that of any given year.

More importantly, the forecast is for a weak or moderate event (“a strong El Niño is not favored in any of the ensemble averages”). On the plus side, you can probably stash away your gold bullion and dehydrated food packets for the next apocalypse. But, there still are plenty weather-related crises to fret over: California drought, Detroit flooding, or Hawaii tropical cyclones.

El Niño July Updates

The July El Niño Expert Discussion update is available from NOAA’s Climate Prediction Center. Not much has changed except maybe the dire predictions of a “super” El Niño have faded. There still as 80% chance of an El Niño between October and December, but the general consensus is for a mid-range event. (I’ll spare you the plethora of numbers — see the CPC’s ENSO page, particularly the weekly updates, for details.) Regardless, even a mediocre event will probably set new records for global high temperatures and areas of droughts, floods, hurricanes, and other such nastiness.

Additionally, Climate.gov’s ENSO Blog posted a couple good articles recently. Today (10 Jul) it is about why we haven’t been seeing the effects of an El Niño, yet — Alaskan and Western Canada warmth, Californian rain, Australian and Indonesian droughts, etc. Several ENSO experts have mentioned recently how the atmosphere hasn’t “seen” the impact of El Niño. The water temperatures are up, but the trade winds and weather patterns don’t act like it. My impression is that the air will eventually catch up, but it will probably be late in the year or into 2015 before anything can be truly attributed to the El Niño.

The other ENSO Blog post is about how the strength of an El Niño doesn’t directly correlate to observed impacts on land. The example they use is the seasonal monsoon in India. South Asia and their over 1 billion inhabitants rely on the monsoons for adequate food for the rest of the year. The strongest El Niño of the 20th Century was in 1997-8, but India actually had above average rain that year. However, the 2002 El Niño was considered moderate to weak and that was one of the driest monsoons on record. The details are at the link, but it is a reminder that there are many unknowns about the effects of any specific El Niño. Don’t let the talk of a moderate event this fall or winter downplay the potential for trouble.

El Niño June Updates

It’s been a busy week for El Niño updates and information. On Monday, NOAA’s Climate Prediction Center (CPC) issued their weekly presentation (pdf). On Tuesday, the Australian Bureau of Meteorology issued their bi-weekly update. On Thursday, the CPC published their monthly discussion. And Saturday, Dr. Michael Ventrice wrote a guest post on Wunderblog.*

In short, an El Niño event is slightly more likely this summer (70% chance vs. 65%) or fall/winter (80% chance). The models currently predict a moderate strength event (+1.0°C to +1.4°C), but Dr. Ventrice is expecting the higher end at +1.5°C. For comparison, the lower limit of an El Niño event is +0.5°C and the “Super” El Niño of 1997-8 was +2.5°C. But, everyone put lots of caveats on these modeled results as estimating the strength of an event is much more difficult than the likelihood of one.

Regardless, Dr. Ventrice emphasizes, “Regardless of what amplitude the ENSO 3.4 Index [ed. El Niño strength] achieves, it only matters if the atmosphere responds.” (Emphasis in original.) His point is that while the Pacific Ocean is highly likely show El Niño-like temperatures, the impact on North America and the Atlantic hurricane season may not appear until August or later. That means there could be heat waves in the central and eastern continental US, continued drought in California, or regular Atlantic hurricanes until the atmosphere “feels” the effects.

* I recommend the Australian website as the easiest to read and understand. CPC’s updates are also good, but can take a few weeks or months to get the hang of the lingo. Dr. Ventrice’s posts are probably the most technical, but also provide excellent coverage into how an El Niño develops and what to watch for in the data.

Climate.gov starts El Niño Blog

No significant updates to the El Niño forecasts, but NOAA’s Climate.gov website has started a new El Niño blog. (Actually, they use the more technically correct term El Niño Southern Oscillation (ENSO), but let’s not argue amongst friends.) The same scientists from the Climate Prediction Center and International Research Institute that write the official NOAA updates will contribute to the blog, so I presume the posts will cover the same issues. But, they probably will be more readable and accessible than the official weekly updates and monthly discussions.

El Niño Forecast up to 65-70%

NOAA’s Climate Prediction Center (CPC) has issued their monthly El Niño diagnostic discussion for May 2014 (permalink). The summary has increased the probability of an event from “exceeding 50%” to “exceeding 65%”. The CPC and International Research Institute (IRI) provides a quick look at the longer term forecasts, which peak at 78% to 79% for Nov or Dec of 2014. The Australian Bureau of Meteorology also issued their bi-weekly update on Tuesday, which cites the likelihood of an El Niño at least at 70%. As the more detailed discussion at Real Climate notes, even with an 80% prediction, there still is a 20% chance that an El Niño will not form.

At this point, however, the more interesting discussion is the forecast intensity. Currently, the average of all the models have the event peak at around 1°C (with the highest model at 1.5°C). This is significantly less than the record-breaking El Niño events in 1983 and 1997-8 of nearly 3°C. The expert discussions are careful to note that strength forecasts at this point are highly unreliable, so there is no guarantee that this will either be an especially mild or strong event.

El Niño Explanation from Skeptical Science

Rob Painting at Skeptical Science has a technical post on the El Niño predicted for later this year. The description is slightly different than ones I have seen elsewhere and adds information from an Australian perspective (or at least in addition to the North American one). It includes some good description of the mechanics of water and air flows around the equator. Regardless, it is an interesting complement to the NOAA-CPC and WunderBlog posts mentioned earlier.

On a side note, I have been noticing many different websites posting on the El Niño forecast alert. I am not going to link to all of them as they seem to regurgitate the same info from the same sources. But, it is a situation that is gaining attention.

Australian El Niño Updates

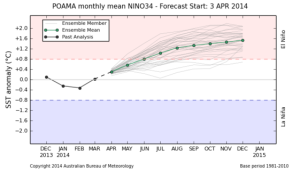
Like NOAA in the US, Australia’s Bureau of Meteorology periodically provides status updates on El Niño conditions and related climate conditions. Today’s update is similar to NOAA’s weekly update, so there isn’t much to add. However, their graphical summary of ENSO models is a little easier to read than NOAA’s. The exact underlying data is different, but the trend and forecast is similar.

Australian BOM Forecast
BOM Model Forecasts

Polar Vortex and Global Warming

Jeff Master’s has a post regarding a recent paper connecting the polar vortex and the California drought to climate change. The discussion itself isn’t all that interesting, but it does have an extensive list of past blog posts and research papers regarding weather circulation patterns. Jeff got me interested in the the North Atlantic Oscillation (NAO) several years ago when Greenland was warmer than Florida. Also, the NAO is oldest known climate oscillations, described several centuries ago by (as Jeff calls them) “seafaring Scandinavians,” which is probably a polite way of saying Vikings. I would like to find more about this history, but have not found much info yet.

Also of note, the strong dipole (high pressure/low pressure pair over North America) discussed in the paper naturally occurs prior to an El Niño event. This ties in to several of my previous posts. This isn’t a cause-and-effect matter, but probably coincident expression of conditions that lead to an El Niño season.

Update to El Niño Forecast

Jeff Master’s has an update post from Dr. Michael Ventrice on the El Niño forecast. As Master’s said, it’s highly technical (and above my pay grade), but still interesting none-the-less. Short story, the models are in greater agreement of El Niño conditions and increased strength. To quote, “the latest climate model forecasts are now more aggressive with the amplitude of the potential emerging El Niño.”

The paired wind bursts around the equator (i.e., the washing machine wringers mentioned last week) have faded, but there appears to be potential activity in the Indian Ocean that could move east. This may form the southern half of a new pair of wringers.

The NOAA Climate Prediction Center April monthly expert assessment is due in a week or so and I’ll post more if that has interesting goodies.

Westerly Wind pulse

Earlier today, I mentioned Jeff Master’s WunderBlog guest post from Dr. Michael Ventrice with a detailed explanation on the signs indicating a significant El Niño event for late 2014. What I found interesting was the pulse of westerly winds that can lead to the El Niño.

The trade winds near the equator typically blow from the east to the west (due to earth’s rotation). This pushes warm surface water where it pools near Indonesia and Australia. Cool deep water then upwells near Chile providing good fishing grounds. To counteract the easterlies, a westerly burst of winds weakens the trade winds. The warm surface waters then stay near Chile and the cool water stays in the ocean’s depths, i.e., an El Niño.

What can cause that westerly pulse? Basically, a pair of cyclones. North of the equator cyclones (or hurricanes in the Atlantic Ocean) rotate counter-clockwise; south of the equator, clockwise. If you have a near simultaneous occurrence of two cyclones bracketing the equator, the rotation will squeeze a burst of wind from west to east. It reminds me of the antique washing machine wringers used to dry clothes.

REA washing machine with wringer